Централизованное планирование запасов
Материал из Supply Chain Management Encyclopedia
Storch (обсуждение | вклад) |
Storch (обсуждение | вклад) |
||
| Строка 31: | Строка 31: | ||
| - | В таблице 2 показано время выполнения заказа для каждого подразделения и соответствующие стандартные отклонения. Для простоты мы предполагаем, что стандартное отклонение времени выполнения заказа при поставке со склада в розничные точки равно нулю. В противном случае сложность модели значительно вырастет, но основная идея более высокой эффективности централизованного управления запасами от этого никак не изменится. Мы предполагаем, что уровень сервиса в управлении запасами равен 99% и, таким образом, можем считать z равным 2,33. Важной особенностью этой модели является то, что стандартное отклонение ежедневного объема спроса на уровне склада составляет 61 коробку в день хотя на уровне розничных магазинов он составляет 3 или 2 соответственно. В децентрализованной системе каждый уровень отрезан от других уровней с точки зрения информации, которая доступна каждому уровню. В этом случае склад не знает реального ежедневного спроса на уровне розницы. Вместо этого склад может наблюдать только заказы, которые поступают от розничных точек. Ежедневный спрос розничной точки 1 на уровне склада будет похож на поток 0, 0, 0, 123 (оптимальный объем заказа), 0, 0, 0, и т. д. Спрос розничной точки 2 будет иметь похожий характер, только размер оптимального заказа в данном случае составит 96. Этот эффект известен как объединение заказов (order batching) - то есть, когда цепь поставок понимает спрос на основе заказов, которые делают следующие участки цепочки создания ценности, а не реальный спрос конечных потребителей. | + | В таблице 2 показано время выполнения заказа для каждого подразделения и соответствующие стандартные отклонения. Для простоты мы предполагаем, что стандартное отклонение времени выполнения заказа при поставке со склада в розничные точки равно нулю. В противном случае сложность модели значительно вырастет, но основная идея более высокой эффективности централизованного управления запасами от этого никак не изменится. Мы предполагаем, что уровень сервиса в управлении запасами равен 99% и, таким образом, можем считать z равным 2,33. Важной особенностью этой модели является то, что стандартное отклонение ежедневного объема спроса на уровне склада составляет 61 коробку в день хотя на уровне розничных магазинов он составляет 3 или 2 соответственно. В децентрализованной системе каждый уровень отрезан от других уровней с точки зрения информации, которая доступна каждому уровню. В этом случае склад не знает реального ежедневного спроса на уровне розницы. Вместо этого склад может наблюдать только заказы, которые поступают от розничных точек. Ежедневный спрос розничной точки 1 на уровне склада будет похож на поток 0, 0, 0, 123 (оптимальный объем заказа), 0, 0, 0, и т. д. Спрос розничной точки 2 будет иметь похожий характер, только размер оптимального заказа в данном случае составит 96. Этот эффект известен как объединение заказов (order batching) - то есть, когда цепь поставок понимает спрос на основе заказов, которые делают следующие участки цепочки создания ценности, а не реальный спрос конечных потребителей. Чем больше число розничных точек, которые обслуживает склад, тем ниже стандартное отклонение спроса для склада, так как заказы из разных магазинов имеют свойство уравновешивать друг друга. Наш пример специально сконструирован для того, чтобы сделать более наглядным эффект объединения заказов (order batching effect) и, таким образом, потенциальные выгоды централизованной системы управления запасами. Сумма среднего уровня запасов для всех розничных точек равна 620 коробкам. |
| - | + | ||
| - | + | ||
| - | + | ||
{| border="1" | {| border="1" | ||
| - | !colspan="4"| | + | !colspan="4"|Таблица 2: Страховой запас и средний уровень запасов при децентрализованной системе управления запасами |
|- | |- | ||
| - | | || | + | | || Склад || Розничная точка 1 || Розничная точка 2 |
|- | |- | ||
| - | | | + | | Время выполнения заказа (LT) || От поставщика на склад = 7 дней|| Со склада в магазин = 1 день|| Со склада в магазин = 1 день |
|- | |- | ||
| - | | | + | | Стандартное отклонение времени выполнения заказа (σLT) || 2 дня || 0 дней || 0 дней |
|- | |- | ||
| - | | | + | | Спрос || 40 коробок / день || 25 коробок / день|| 15 коробок / день |
|- | |- | ||
| - | | | + | | Стандартное отклонение спроса (σD) || 61 || 3 || 2 |
|- | |- | ||
| <math>\mbox {Safety stock}=z\sqrt {LT \cdot \sigma D^2+D^2 \cdot \sigma LT^2}</math> | | <math>\mbox {Safety stock}=z\sqrt {LT \cdot \sigma D^2+D^2 \cdot \sigma LT^2}</math> | ||
| Строка 59: | Строка 56: | ||
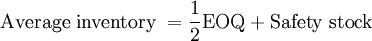
|| <math>= \frac {1}{2} 96 + 5=53</math> | || <math>= \frac {1}{2} 96 + 5=53</math> | ||
|- | |- | ||
| - | !colspan="4"| | + | !colspan="4"|Суммарный уровень средних запасов = 498+69+53 = 620 |
|} | |} | ||
| - | == | + | ==Пример (продолжение): Централизованная модель== |
The '''Centralized''' inventory planning system is characterized by the presence of a single entity that has access to system-wide information about inventory levels and demand. In this example, the centralized planner would have access to relevant information at both the warehouse and retail levels. In the '''Decentralized''' model, the warehouse sees demand as order batches. Under the centralized system, the vision of demand is actual demand at the retail level -- order batches are thus eliminated as a signal of demand and is replaced with information on actual demand. The simplified model for saefty stock (Table 3) utlizes the echelon lead time of 8 days. This represents the lead time from the vendor to the retail outlets. The standard deviation in lead time remains unchanged from the '''Decentralized''' model at 2 days. The assumption of zero variance in the lead time from the warehouse to the retail stores was undertaken for model simplification purposes. Demand of 40 cases per day remains unchanged. The standard deviation in daily demand decreases radically from 61 to 3.61. Two issues are relevant. First, VAR(X+Y)= VAR(X)+Var(Y)+2×Covar(X,Y). We have assumed that the covariance in demand across retail outlets is null. In reality this is generally not the case and, given, such we are overestimated the effect of the '''Centralized''' model on the change in inventory. Second, and as already mentioned, the greater the number of retail outlets served, the rgreater the ability of demand from one outlet to offset demand from another retail outlet. We are thus in a second fashion overestimating the reality of what a '''Centralized''' model can accomplish in terms of inventory reduction reality by modeling just two retail outlets. Given these cautions, safety stock is avaluated at 81 cases, the EOQ unchanged from the Decentralized model at 156, and total system inventory at 159. It is important to note that the system-wide inventory now refers to all inventory at the retail outlets, are the warehouse, and at in transit from the warehouse to the retail outlets. The system-wide inventory fell dramtically from the '''Decentralized''' model (620) to the '''Centralized''' model (159). In practice, these sort of decrease cannot be expected. | The '''Centralized''' inventory planning system is characterized by the presence of a single entity that has access to system-wide information about inventory levels and demand. In this example, the centralized planner would have access to relevant information at both the warehouse and retail levels. In the '''Decentralized''' model, the warehouse sees demand as order batches. Under the centralized system, the vision of demand is actual demand at the retail level -- order batches are thus eliminated as a signal of demand and is replaced with information on actual demand. The simplified model for saefty stock (Table 3) utlizes the echelon lead time of 8 days. This represents the lead time from the vendor to the retail outlets. The standard deviation in lead time remains unchanged from the '''Decentralized''' model at 2 days. The assumption of zero variance in the lead time from the warehouse to the retail stores was undertaken for model simplification purposes. Demand of 40 cases per day remains unchanged. The standard deviation in daily demand decreases radically from 61 to 3.61. Two issues are relevant. First, VAR(X+Y)= VAR(X)+Var(Y)+2×Covar(X,Y). We have assumed that the covariance in demand across retail outlets is null. In reality this is generally not the case and, given, such we are overestimated the effect of the '''Centralized''' model on the change in inventory. Second, and as already mentioned, the greater the number of retail outlets served, the rgreater the ability of demand from one outlet to offset demand from another retail outlet. We are thus in a second fashion overestimating the reality of what a '''Centralized''' model can accomplish in terms of inventory reduction reality by modeling just two retail outlets. Given these cautions, safety stock is avaluated at 81 cases, the EOQ unchanged from the Decentralized model at 156, and total system inventory at 159. It is important to note that the system-wide inventory now refers to all inventory at the retail outlets, are the warehouse, and at in transit from the warehouse to the retail outlets. The system-wide inventory fell dramtically from the '''Decentralized''' model (620) to the '''Centralized''' model (159). In practice, these sort of decrease cannot be expected. | ||
Версия 16:19, 11 августа 2011
English: Centralized inventory planning
Многоступенчатая система управления запасами предполагает ситуацию, при которой одно подразделение (напр., склад) обслуживает множество точек спроса (напр., розничные магазины). Базовая модель оптимального объема заказа и модель управления запасами в условиях неопределенности спроса и времени выполнения хорошо применимы к ситуациям, когда одно подразделение управляет своими собственными запасами и не должно заботиться о запасах других подразделений, находящихся ниже в цепочке создания ценности. Предположим, что у нас есть система, в которой единый склад снабжает два ресторана. Если склад и оба ресторана будут независимо друг от друга применять базовую модель оптимального объема заказа или модель управления запасами в условиях неопределенности и времени выполнения, тогда:
- каждый участник этой системы будет оптимизировать свою результативность:
- однако система в целом будет испытывать проблемы от того, что ни одно из подразделений не думает об общей результативности.
Разработчики системы управления должны выбрать между двумя стратегическими вариантами управления цепями поставок:
- Децентрализация: стратегия, при которой каждый уровень в цепи поставок (напр., производитель, оптовый торговец, розничный торговец) оптимизирует свою результативность и товаро-материальные запасы независимо от других уровней цепи поставок;
- Централизация: стратегия, при которой единый плановый орган имеет доступ к информации множества уровней в цепи поставок и, таким образом, можем составлять план управления запасами для всей системы. Например, в обычной розничной сети каждый розничный магазин предоставляет информацию о реальном спросе плановому органу, который затем может разработать обобщенную политику управления запасами для всей системы.
Существует целый ряд многоступенчатых моделей управления запасами, хотя многие из них являются весьма сложными с точки зрения математики. Нашей целью является демонстрация упрощенной модели для иллюстрации того, как работает многоступенчатое управления запасами и каковы потенциальные выгоды такой системы по сравнению с децентрализованными системами. Многоуровневая модель, которую мы приводим ниже, является конкретным примером того, как работает централизованная система управления запасами.
Пример: Децентрализованная модель
Рассмотрим сначала как работает децентрализованная система управления запасами. Предположим, что розничных торговец управляет одним складом и двумя розничными магазинами. Единицей анализа в нашем случае является одна коробка продукта, имеющая ценность (v) равную 12. Используется электронное размещение заказов, при которой затраты на подачу заказа (K) постоянны и низки (2). Норма ежегодных затрат на поддержание запасов (c) составляет 0,20. Все показатели будут измеряться в днях. Таким образом, ценность поддержания запасов на одну коробку в заданный период времени (h) равна:
- = c × v / 365
- = 0.20 × 12 / 365 = 0.0066
Следующим шагом в оценке децентрализованной политики является оценка отдельных оптимальных объемов заказа для каждого подразделения. В Таблице 1 показаны постоянные затраты заказа (fixed order cost???) и величина h (одинаковая для всех трех подразделений), объем спроса в день в коробках, и значения оптимального размера заказа.
| Таблица 1: Исходные данные для оценки оптимального объема заказа EOQ | |||
|---|---|---|---|
| K=2; h=.0027 | Склад | Розничная точка 1 | Розничная точка 2 |
| Спрос | 40 коробок / день | 25 коробок / день | 15 коробок / день |
 | 
|  | 
|
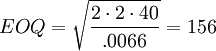
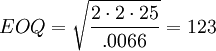
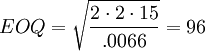
В таблице 2 показано время выполнения заказа для каждого подразделения и соответствующие стандартные отклонения. Для простоты мы предполагаем, что стандартное отклонение времени выполнения заказа при поставке со склада в розничные точки равно нулю. В противном случае сложность модели значительно вырастет, но основная идея более высокой эффективности централизованного управления запасами от этого никак не изменится. Мы предполагаем, что уровень сервиса в управлении запасами равен 99% и, таким образом, можем считать z равным 2,33. Важной особенностью этой модели является то, что стандартное отклонение ежедневного объема спроса на уровне склада составляет 61 коробку в день хотя на уровне розничных магазинов он составляет 3 или 2 соответственно. В децентрализованной системе каждый уровень отрезан от других уровней с точки зрения информации, которая доступна каждому уровню. В этом случае склад не знает реального ежедневного спроса на уровне розницы. Вместо этого склад может наблюдать только заказы, которые поступают от розничных точек. Ежедневный спрос розничной точки 1 на уровне склада будет похож на поток 0, 0, 0, 123 (оптимальный объем заказа), 0, 0, 0, и т. д. Спрос розничной точки 2 будет иметь похожий характер, только размер оптимального заказа в данном случае составит 96. Этот эффект известен как объединение заказов (order batching) - то есть, когда цепь поставок понимает спрос на основе заказов, которые делают следующие участки цепочки создания ценности, а не реальный спрос конечных потребителей. Чем больше число розничных точек, которые обслуживает склад, тем ниже стандартное отклонение спроса для склада, так как заказы из разных магазинов имеют свойство уравновешивать друг друга. Наш пример специально сконструирован для того, чтобы сделать более наглядным эффект объединения заказов (order batching effect) и, таким образом, потенциальные выгоды централизованной системы управления запасами. Сумма среднего уровня запасов для всех розничных точек равна 620 коробкам.
| Таблица 2: Страховой запас и средний уровень запасов при децентрализованной системе управления запасами | |||
|---|---|---|---|
| Склад | Розничная точка 1 | Розничная точка 2 | |
| Время выполнения заказа (LT) | От поставщика на склад = 7 дней | Со склада в магазин = 1 день | Со склада в магазин = 1 день |
| Стандартное отклонение времени выполнения заказа (σLT) | 2 дня | 0 дней | 0 дней |
| Спрос | 40 коробок / день | 25 коробок / день | 15 коробок / день |
| Стандартное отклонение спроса (σD) | 61 | 3 | 2 |

| 
| 
| 
|
| 
| 
| 
|
| Суммарный уровень средних запасов = 498+69+53 = 620 | |||
Пример (продолжение): Централизованная модель
The Centralized inventory planning system is characterized by the presence of a single entity that has access to system-wide information about inventory levels and demand. In this example, the centralized planner would have access to relevant information at both the warehouse and retail levels. In the Decentralized model, the warehouse sees demand as order batches. Under the centralized system, the vision of demand is actual demand at the retail level -- order batches are thus eliminated as a signal of demand and is replaced with information on actual demand. The simplified model for saefty stock (Table 3) utlizes the echelon lead time of 8 days. This represents the lead time from the vendor to the retail outlets. The standard deviation in lead time remains unchanged from the Decentralized model at 2 days. The assumption of zero variance in the lead time from the warehouse to the retail stores was undertaken for model simplification purposes. Demand of 40 cases per day remains unchanged. The standard deviation in daily demand decreases radically from 61 to 3.61. Two issues are relevant. First, VAR(X+Y)= VAR(X)+Var(Y)+2×Covar(X,Y). We have assumed that the covariance in demand across retail outlets is null. In reality this is generally not the case and, given, such we are overestimated the effect of the Centralized model on the change in inventory. Second, and as already mentioned, the greater the number of retail outlets served, the rgreater the ability of demand from one outlet to offset demand from another retail outlet. We are thus in a second fashion overestimating the reality of what a Centralized model can accomplish in terms of inventory reduction reality by modeling just two retail outlets. Given these cautions, safety stock is avaluated at 81 cases, the EOQ unchanged from the Decentralized model at 156, and total system inventory at 159. It is important to note that the system-wide inventory now refers to all inventory at the retail outlets, are the warehouse, and at in transit from the warehouse to the retail outlets. The system-wide inventory fell dramtically from the Decentralized model (620) to the Centralized model (159). In practice, these sort of decrease cannot be expected.
| Table 3: Evaluating Average Inventory for Centralized Inventory Planning System | |
|---|---|
| Echelon (Warehouse to Retail Outlets) | |
| Lead time (LT) | Vendor to retail outlets = 8 days |
| Standard deviation in lead time (σLT) | 2 days |
| Demand | 40 cases / day |
| Standard deviation in demand (σD) | 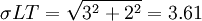
|

| 
|
| |
|
|
| 
|
| Total average system-wide inventory = 159 | |
Several other issues require attention:
- In the analysis, all that changed was the elimination of the order batching effect. In practice, such an elimination requires additional information technology expenditures. For example, point-of-sale data needs to be used for much more tha price-look-up. It needs to be provided to the centralized inventory planning unit.
- Improved efficiency in the warehousing system is generally accompanied by a shift from a Decentralized to a Centralized model. Under the former, the warehouse is used to store product that is shipped when retail store orders are obtained. Ideally, under the latter, inventory is allocated to a particular retail outlet before it arrives at the warehouse. The warehouse thus shifts from a role primarily consisting of storage to flow-through. Technically advanced retailers utilize comlpex cross docking warehouse technologies.
- These systems are generally best suited to standard products with repetitive order cycles. Data is easily acquired on demand per day (or week) at different locations and may be used in evaluating demand and lead time distributions. Moving averages are commonly used to evaluate such distributions. In contrast, highly seasonal products with a single order cycle (e.g., household decorations for religious holidays) are not well suited to such systems. In many instances, retailers work with an in-store date and use warehouses as buffer locations to ensure product availability.
- The question arises as to what firm in the channel should act the part of Centralized planner. That depends on the complexity of the production versus retailing and the relative meaninfulness of point-of-sale data. When the products are standard and repetitively sold, and when the retailer is large, then the manufacturer is often the Centralized planner. That is because it is more effiecient from a knowledge perspective for the manufacturer to plan its own production and to feed the retail system using final demand signals than it is for the retailer to plan production for the manufacturer. Centralized inventory planning is often associated with vendor managed inventory, however, this only holds when it is the manufacturer that is the Centralized planner. When point-of-sale-data captures less meaningful information, as in the case of rapidly changing fashion products, then it is often the retailer that is the Centralized planner. For example, the GAP and H&M fashion retail chains outsource much of their production, however, they retain control over production scheduling and the timining and flows of materials from factories to retail outlets.


